
Describe Image tasks take an important part of the PTE test speaking module. It contributes solely to your speaking score which includes pronunciation and oral fluency. There are 6-7 Describe Image questions appear in the PTE test. You will have 25 seconds to prepare and 40 seconds to respond for each task.
If you score well in this section, you will get an overall good speaking score. However, if there is hesitation or unnecessary stops you will get a low score, no matter how perfectly you describe the image. Therefore, good templates can significantly improve your speaking fluency and that you will get a confidence boost when you begin the following speaking modules (Retell Lecture, Repeat Sentences, Answer Short Questions…). Of course, your overall speaking score will increase dramatically.
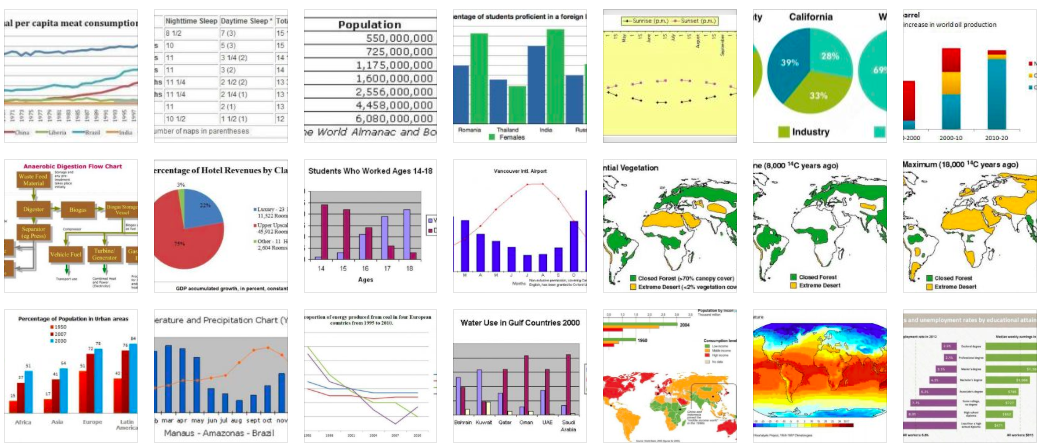
There are 8 types of Describe Images typically show in the PTE Academic Test.
Bar Chart
Pie Chart
Line Chart
Table
Flow Chart
Map
Mixed Chart
Picture
Take a loot at our perfect describe image templates to achieve perfect speaking score.
1. Bar Chart
First of all, bar chart is the best type to practice your Describe Image task with templates. Because it provides all of the factors clearly and logically. These factors include the topic, figures, differences or similarities and so on.
Bar Chart Describe Image Template:
- The bar chart represents the information about (TOPIC/ TITLE).
- As we can see from the chart, the highest figure is (FIGURE) which is (NAME), following by (NAME).
- However, the lowest figure is (FIGURE) which is (NAME).
- In conclusion, it can be seen that (SIMILARITY/ DIFFERENCE).
2. Pie Chart
This is similar to the bar chart, you can simply mention the highest and lowest figures and any other important features (similarity/ difference) that show in the pie chart.
Pie Chart Describe Image Template:
- The pie chart illustrates the information about (TOPIC/ TITLE).
- It is clear from the pie chart that this largest figure is (FIGURE) which is (NAME), following by (NAME).
- However, the smallest part is occupied by (NAME), which is (FIGURE).
- In conclusion, it can be said that (SIMILARITY/ DIFFERENCE).
3. Line Chart
Before talking about the line chart template, we should know that there are 3 basic line charts in the PTE Describe Image task – single line, parallel line, and cross line charts. The most significant part is describing these trends clearly.
These sentences may be helpful when you describe a trend.
“the figures rose sharply to reach a peak of ……”
“the number gradually declined to reach a low of ……”
“the figures fluctuated between …… and …….”
“it gradually rose, peaking at ……”
“after several ups and downs, it touched a peak/low of ……”
“the number eventually decreased/increased to ……”
Line Chart Describe Image Template:
- The line chart describes information about (TOPIC/ TITLE).
- The highest figure in (NAME) is at (FIGURE), and it gradually declined/increased to reach a low/high of ((FIGURE).
- In contrast, the lowest figure in (NAME) is at (FIGURE), and it gradually rose/dropped to (FIGURE).
- In conclusion, it can be seen that (TREND).
4. Table Chart
In this type, it is unnecessary describe all of the figures in the table. It is important to find out the comparative figures or trends first, and simply mention the elements that are provided in the chart.
Table Chart Describe Image Template:
- The table provides important information about (TOPIC/TITLE).
- As we can see from the table, there are several figures in terms of (ELEMENT A), (ELEMENT B), (ELEMENT C)… …
- The highest figure is (FIGURE) which is (NAME), while the lowest figure is (FIGURE) which is (NAME).
- Moreover, from (TIME) to (TIME), the figure of (NAME) was increased/decreased significantly/gradually.
- In conclusion, it can be said that (TREND).
5. Flow Chart
Flow chart requires to describe a process in sorted order. Therefore, you need to master vocabularies regarding to some changes such as “develop”, “convert”, “transform”, and “turn into”. This task is sometimes tricky because there are too many or few processes to describe for 40 seconds. The core part to complete this type of task is that cut off or add more details from the provided flow chart.
Flow Chart Describe Image Template:
- The flowchart/ diagram gives the process/ life cycle of (TOPIC/TITLE).
- There are various steps/stages in the flow chart.
- Initially/ in the first step/stage, (THE FIRST PROCESS).
- Moreover, it is transformed/converted into (THE SECOND PROCESS).
- In the next step/stage, it is further developed/turns into (THE THIRD PROCESS).
- Finally, (THE FINAL PROCESS).
5. Map, Mixed Chart, and Picture
For these three types, there are no special universal template can be used. However, you can always practice with more real exam questions and apply different types of describe image templates flexibly. For example, you may change the flow chart template a bit to describe a map.
Map Describe Image Template:
- The map provides information about (TOPIC/TITLE).
- There are various places described in the map such as (PLACE NAMES).
- Initially, in the north, (FACTS/ELEMENTS).
- Moreover, in the middle part of the map, (FACTS/ELEMENTS).
- Lastly, in the south, (FACTS/ELEMENTS).
- In conclusion, (FACTS/TREND)
For more information related to PTE Describe Image Question Bank, click on PTE All in One Question Bank.
PTE exam question bank for June 2026
Latest PTE exam question bank Are you preparing for the PTE Academic exam in 2026? Gain a competitive advantage with…
Group Project – PTE Summarize Group Discussion
PTE Summarize Group Discussion – Group Project Narration: Three…
Complaint in Library – PTE Summarize Group Discussion
PTE Summarize Group Discussion – Complaint in Library Narration:…
PTE exam question bank for April 2026
Latest PTE exam question bank Are you preparing for the PTE Academic exam in 2026? Stay ahead with the latest…