
PTE Bank team analysed all of Describe Image Questions which are repeatedly showed in recent PTE exams (October – November 2019), and here are some of them.
1. Tomato Life Cycle
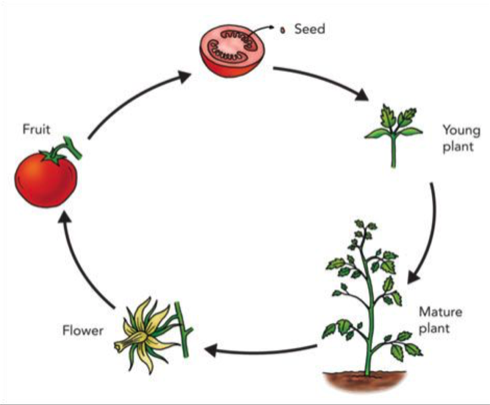
PTE Describe Image Sample Answer – Tomato Life Cycle
The flow chart represents the life cycle of a tomato plant. A tomato plant begins life as a seed. The seed becomes a young plant as it grows roots that reach into the soil and a stem that grows toward the sun. As it grows taller, it becomes a mature plant with a strong stem and many leaves. When the season is right, the mature plant grows flowers. The flowers mature into fruit that we call a tomato. Inside each fruit are many new seeds. In conclusion, the picture gives information about different stages of the tomato.
2. Sweden Government Budget

PTE Describe Image Sample Answer – Sweden Government Budget
The picture represents the Sweden government budget in 2018. As we can see from the picture, there are two sections are compared which are expenditure SEK and Revenue SEK respectively. The figure of revenue SEK is higher than that of Expenditure SEK, and the surplus seems to be over 44 billion. Specifically, the revenue SEK is occupied 1043 billion, while the expenditure SEK is 999 billion. In conclusion, the Sweden government budget for expenditure is lower than its revenue in 2018.
3. Municipalities and Precipitation of Gariep Basin
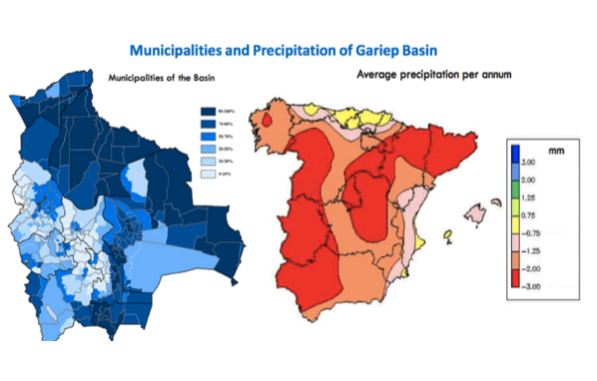
PTE Describe Image Sample Answer – Municipalities and Precipitation of Gariep Basin
The picture is about the municipalities and precipitation of Gariep Basin. According to the picture, we can find that 90 to 100% of municipalities can be found in the North and East of Basin. Followed by that 30 to 50% of municipalities can be found in the central of Basin. Besides, in terms of average precipitation, the record range is from 3mm to -3 mm. The west and north east of the Basin is extremely dry which has the record of -3mm. In conclusion, the development of the city might have close relation with precipitation since we can find lower percentage of municipalities is in the area with low precipitation.
For more information related to PTE Describe Image Question Bank, click on Describe Image Templates to achieve 79+

PTE exam question bank for June 2026
Latest PTE exam question bank Are you preparing for the…
Group Project – PTE Summarize Group Discussion
Complaint in Library – PTE Summarize Group Discussion
PTE exam question bank for April 2026
Latest PTE exam question bank Are you preparing for the…